In this bite you will learn about what correlation is in research, how to analyse scatter plots and how to interpret statistical output to help you understand correlation in others research and give you the confidence to use it in your own.
Correlation in the real world
In research, we often want to know whether a relationship exists between phenomena we have observed. For example, it might be useful to know whether eating a certain type of food is related to rates of obesity, or whether living in a certain area is correlated with life expectancy or perhaps if a new advertisement is related to the number of product sales. Correlation is an extremely useful non-experimental method to gain insight into the relationships that exists around us.
Here are some examples of real-world correlations, some of which are obvious and others might be surprising!
- The more coffee you drink the more hours are spent awake
- As salary increases so does spending
- The more classes a student misses, the more likely their grades are to decrease
- As ice-cream sales increase so does murder
What is correlation?
Correlation is a measure of the relationship between two variables. Correlations can either be positive or negative. A positive correlation means that as one variable (x) increases so does the other variable (y). A negative correlation on the other hand means that as one variable (x) increases the other (y) decreases. Let’s go through the scatterplots below to explore visually the different types of correlation.
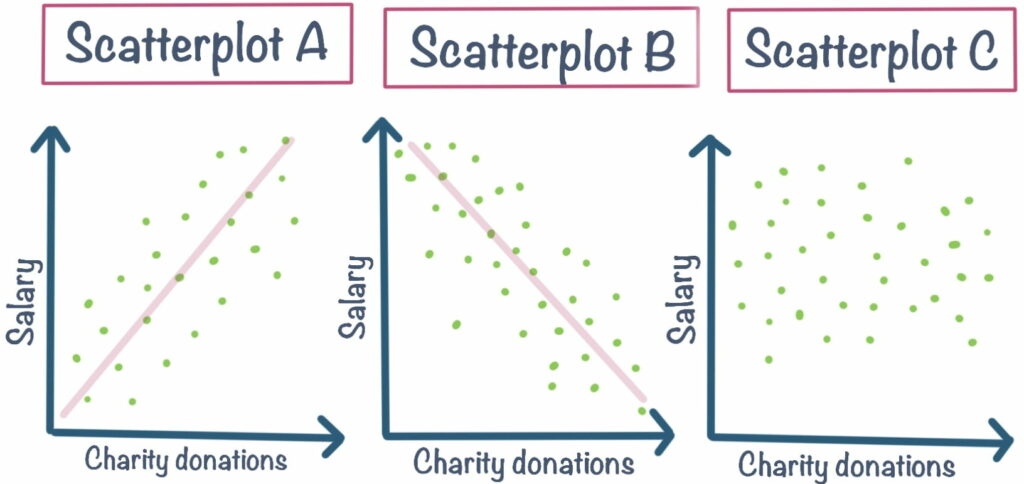
So, let’s say you are interested in whether there is a relationship between the amount of money a person has and the amount they donate to charity. Scatterplot A tells us that the higher salary one has, the more they donate to charity, meaning they are positively related. It looks like a fairly strong relationship, as the data points are clustered quite closely around the positively sloped line. Scatterplot B shows on the other hand that the higher salary one has, the less they are likely to donate to charity, meaning they are negatively related. Again, this looks like a fairly strong relationship. Scatterplot C shows that there is no relationship between these variables, meaning salary is unrelated to how much one is likely to donate to charity. Check out this article for more examples of scatterplots and how to analyse them.
Correlation does not mean causation!
Now we introduce the age-old mantra of “correlation does not imply causation”. It is very important to understand and sometimes easy to forget with all the spurious correlations presented in the media. If you remember from the examples of correlation earlier you might have been surprised by the last one— that ice cream sales are positively related to murder rates. It is here you can see the importance of the mantra, as it would be ridiculous to claim that ice-sales cause higher rates of murder. Likewise, with the other real-world correlations, we can only say the relationship exists, we cannot say which variable, if any, are the cause of a change in another variable. Take a look at the following video which explains correlation and why this is the case
The correlation coefficient
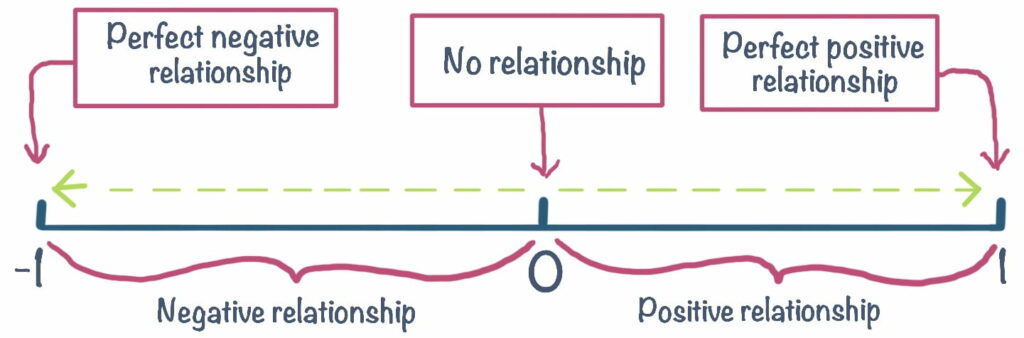
The correlation coefficient (represented as r) is generated when performing correlation analysis in statistical software. Pearson’s correlation is the most common correlation analysis, whilst Spearman’s is the alternative used when the assumptions of Pearson’s have not been met. The correlation coefficient measures the direction and strength of the relationship we discovered in our scatterplots. We can only estimate how strong a suspected relationship might be by looking at a scatterplot, therefore we need a numerical indicator to tell us exactly how strong or weak the relationship is. The correlation coefficient exists between -1 and 1, with -1 indicating a perfect negative correlation and 1 indicating a perfect positive correlation. 0 implies no correlation exists at all.
Here are some rules of thumb according to Evans (1999) which determine the strength of the relationship based on r;
- r = 0 – 0.19 is considered a very weak relationship
- r = 0.20 – 0.39 is considered a weak relationship
- r = 0.40 – 0.59 is considered a moderate relationship
- r = 0.60 – 0.79 is considered a strong relationship
- r = 0.80 – 1 is considered a very strong relationship
Interpreting and writing up correlation analysis
The output for correlation analysis will look different depending on the software you are using but all that is important to recognize in the output is r and the significance level associated with r (the p-value). Remember, only calculate r through correlation analysis after visually inspecting a scatterplot which shows a relationship. There is no point in calculating the correlation coefficient if there is no observed relationship! Below is an example sentence where you can plug in your own numbers when writing your report.
You want to let your reader know the exact statistical analysis you used and also the variables you are testing for a potential relationship.
“A (the statistical test used) was performed to investigate the relationship between (variable 1) and (variable 2).”
You also want to let your reader know the direction and strength of the relationship through words and also by presenting the correlation coefficient and associated significance level.
Results of the test showed there was a (positive/negative), (weak/moderate/strong) correlation between the two variables (r = x, p = x).
If we fill this in with an example, we get a sentence that looks like this;
“A Pearson’s correlation was performed to investigate the relationship between salary and how much one annually donates to charity. Results of the test showed there was a positive, strong relationship between the two variables (r = .68, p=.004).”